School Performance 25/26 (Standards)
National Average EYFS and KS1 Data
The information below compares the assessments in 2025 of our pupils against national averages.
Early Years Foundation Stage:
76% of pupils in Reception with a mainstream school trajectory attained a Good Level of Development according to the Early Years Framework. The 2025 national percentage was 68.3%.
A Good Level of Development is defined as children working at the expected standard or exceeding the expected standard in the key areas of literacy, maths, physical development, communication and language and personal, social and emotional development.
Year One Phonic Screening:
School data reports 81% of pupils in Year One with a mainstream school trajectory attaining the expected standard in the Phonics Screening test. The tested cohort was 52. The 2025 national average was 80%.
End of Key Stage Two:
* It’s not possible to calculate KS1 to KS2 progress measures for the 2023/24 or 2024/25 academic years. There is no KS1 baseline available to calculate primary progress measures for these years because of COVID-19 disruption.
|
|
CPS |
National Average 2025 |
|
Reading, Writing and Maths Combined ES |
55% |
62% |
|
Reading, Writing and Maths Combined GD |
12% |
8% |
|
Reading Expected Standard |
62% |
75 % |
|
Reading Greater Depth |
26% |
33% |
|
Writing Expected Standard |
67% |
72% |
|
Writing Greater Depth |
12% |
13% |
|
Maths Expected Standard |
67% |
74% |
|
Maths Greater Depth |
21% |
26% |
|
Grammar and Punctuation Expected Standard |
60% |
73% |
|
Grammar and Punctuation Greater Depth |
18% |
30% |
|
Science |
74% |
82% |
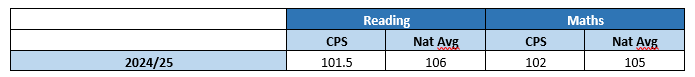
Average Scaled Scores:
- Expected Standard: A scaled score of 100 or more means a child is meeting the government's expected standard for their age.
- Greater Depth: A scaled score of 110 or more means a child is working at a "greater depth" of understanding.
- Working Towards: A scaled score of 99 or below means the child is not meeting the expected standard, but is still considered "working towards" it.